Case Study
How Destinations Can Win with Holiday Webpages
We analyzed holiday content across 40 US destinations to see which pages earn reach, which bring travelers in, and which do both.
October 21, 2026
Updated October 21, 2026Every season, destinations publish lights guides, event calendars, and market roundups to capture holiday travel. Not every page pulls the same weight. Some earn big reach, much of it organic. Others are seen by fewer people but turn a high share of them into real-world visits.
We analyzed website attribution data from 40 US destinations for the 2025 holiday season, ranking page types by impressions and by visit rate (visits divided by impressions). The study identifies the content categories that most often ranked among top performers on each measure, and the few that consistently landed on both.
The Result
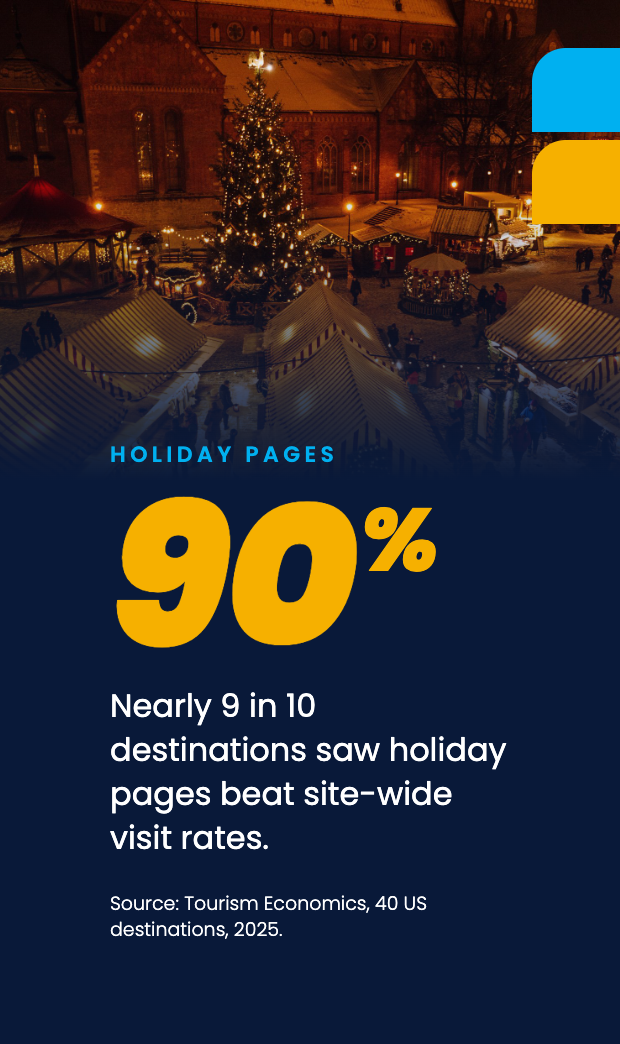
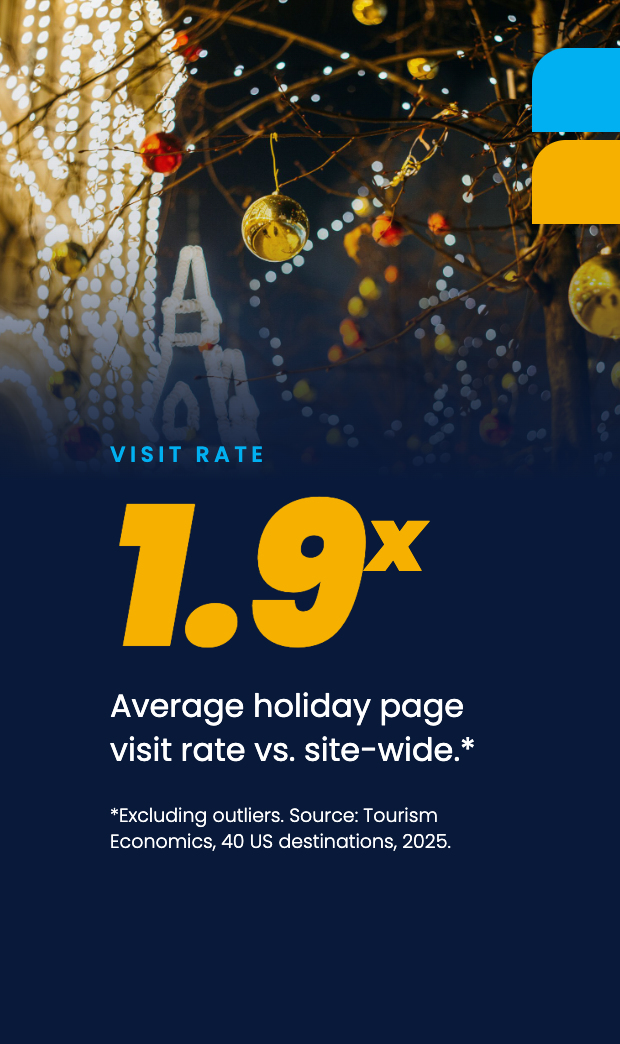
Nearly 90% of destinations saw holiday pages convert above their site-wide visit rate, even though those pages drew only a small share of total site impressions. On average, holiday page groups converted at 1.9x the site-wide visit rate.
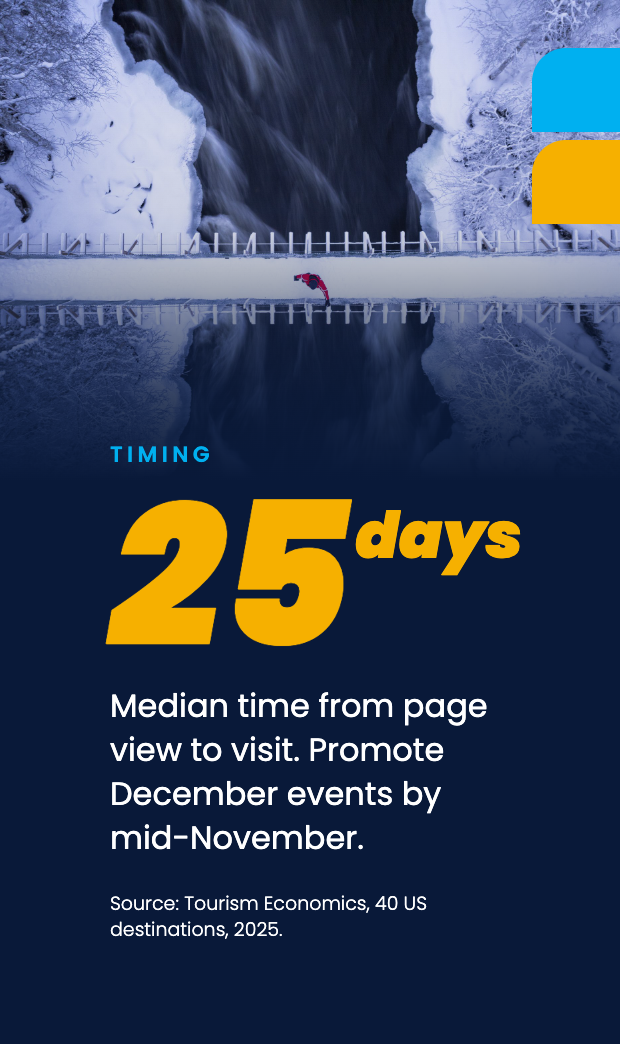
Going deeper, we explore how specific page topics performed across destinations. Plus, optimal times to start promoting December events.
Download the full case study for the four steps to find your own top performers in your attribution dashboards. And find out which holiday pages are worth amplifying this season.

1/0